Investing in the UK requires a thorough understanding of key macroeconomic indicators and international currency movements. This page provides a comprehensive analysis of the Bank of England (BoE) official interest rate, key exchange rates and their historical movements.
The information presented provides investors with a strategic framework for assessing risks and opportunities, taking into account both the UK domestic market and the impact of currency fluctuations on Italian and Swedish investors. The analysis combines official historical data with up-to-date visualisations, providing a clear and accessible view of the most relevant economic trends.
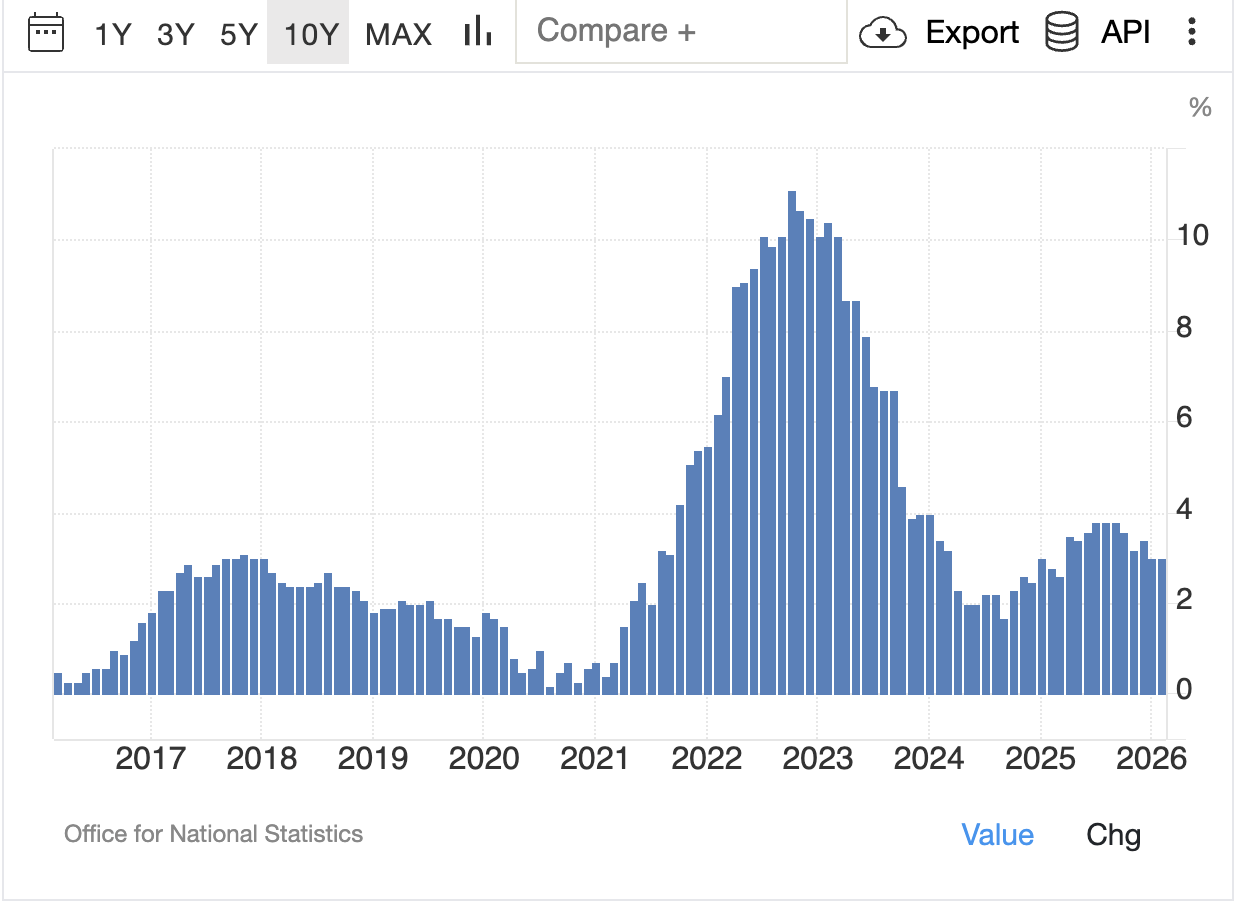
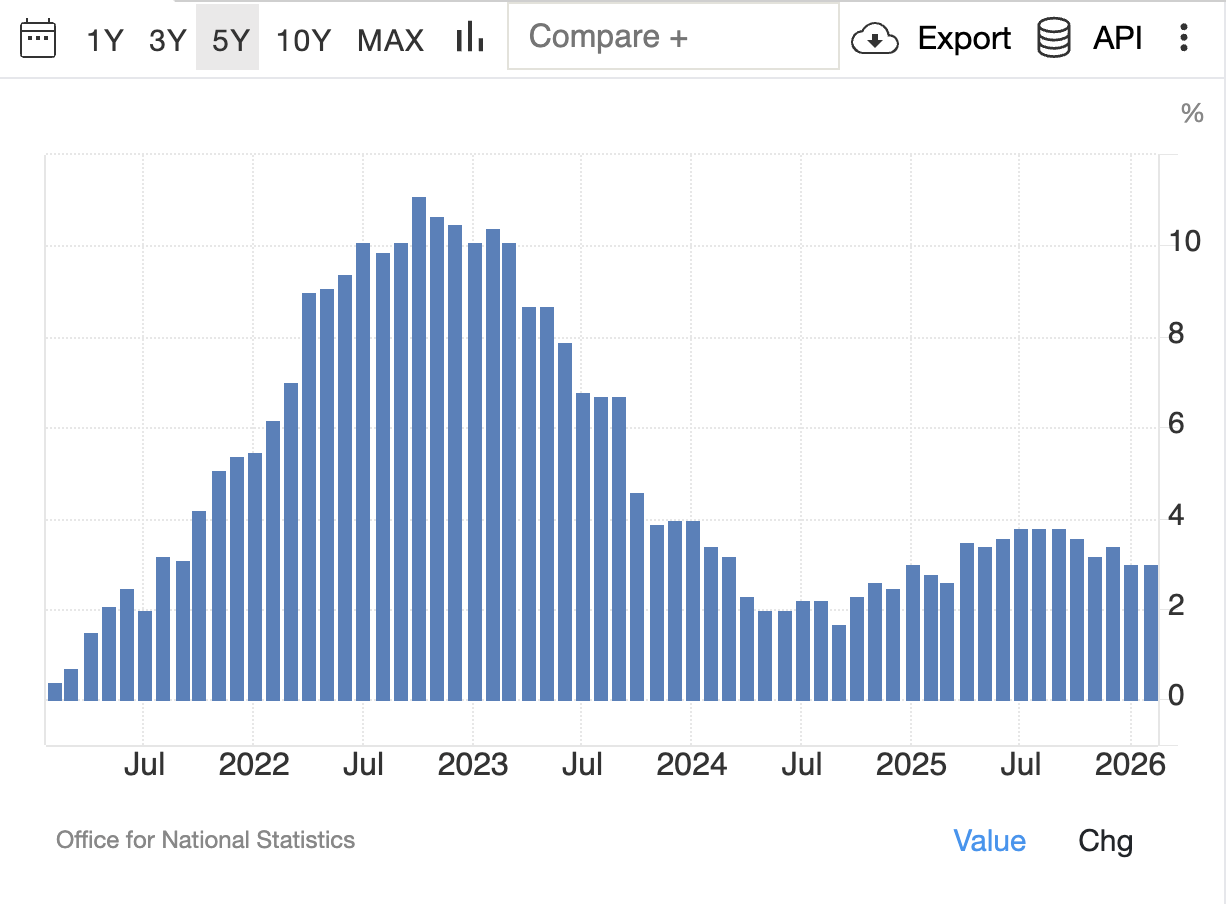
The Bank of England’s official interest rate is one of the key monetary indicators for the UK economy. The chart illustrates the evolution of the official rate over time.
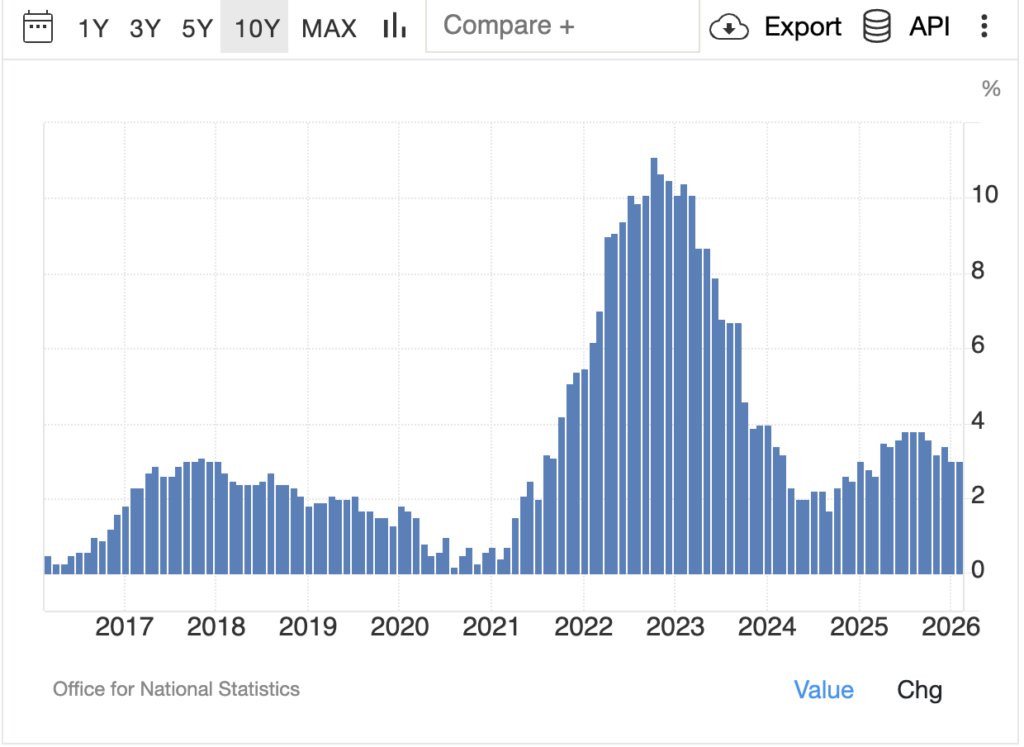
The chart shows the historical development of the Bank of England’s official interest rate over the past 10 years, a key indicator of UK monetary policy. It illustrates how interest rates were progressively raised in response to post-pandemic inflation and changes in the global macroeconomic environment.
Changes in the official rate have a direct impact on the cost of borrowing for businesses and on the yields of UK government bonds. This indicator helps assess the BoE’s approach to stimulating or restraining economic activity, influencing financing costs for those investing in the UK. The chart also highlights periods of high and low interest rates, providing a clear picture of monetary policy over time.
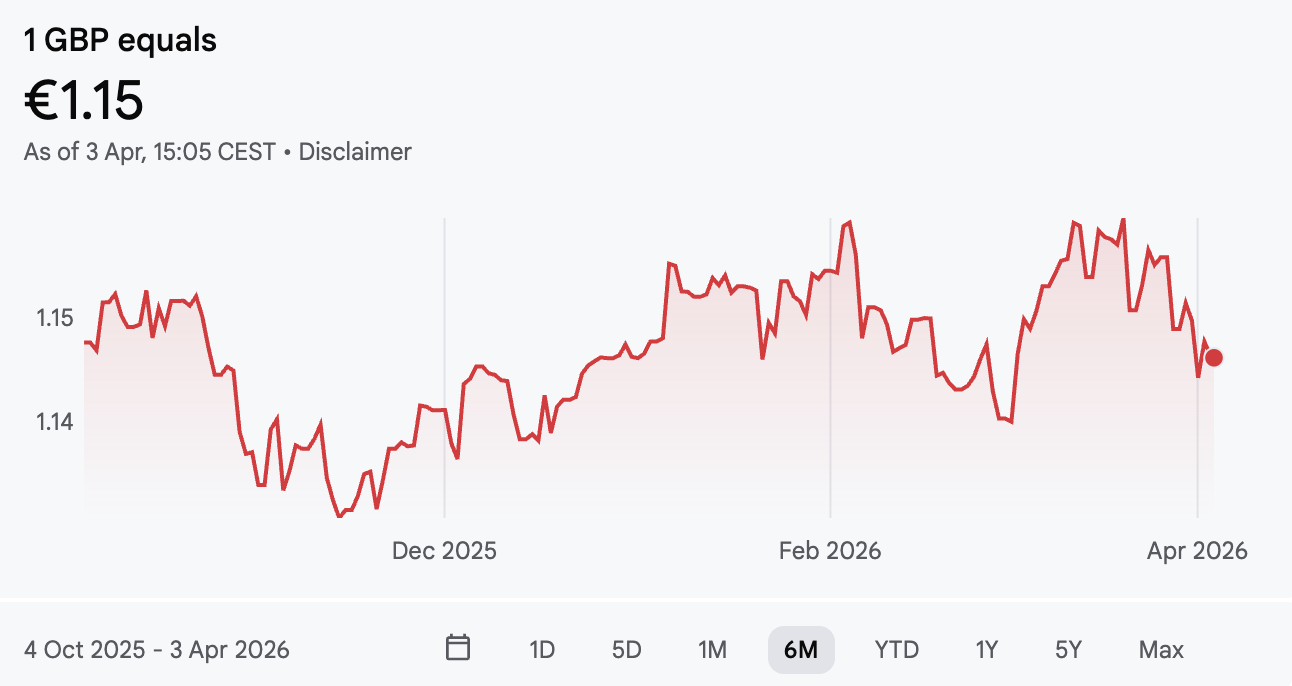
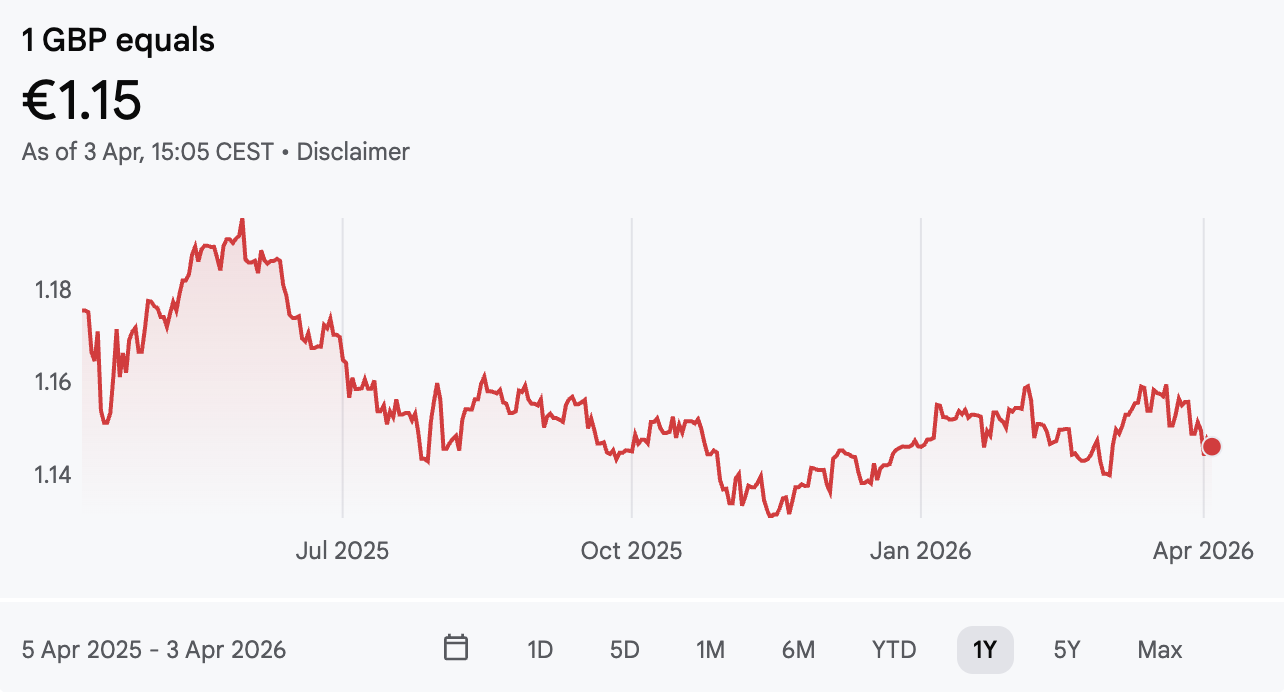
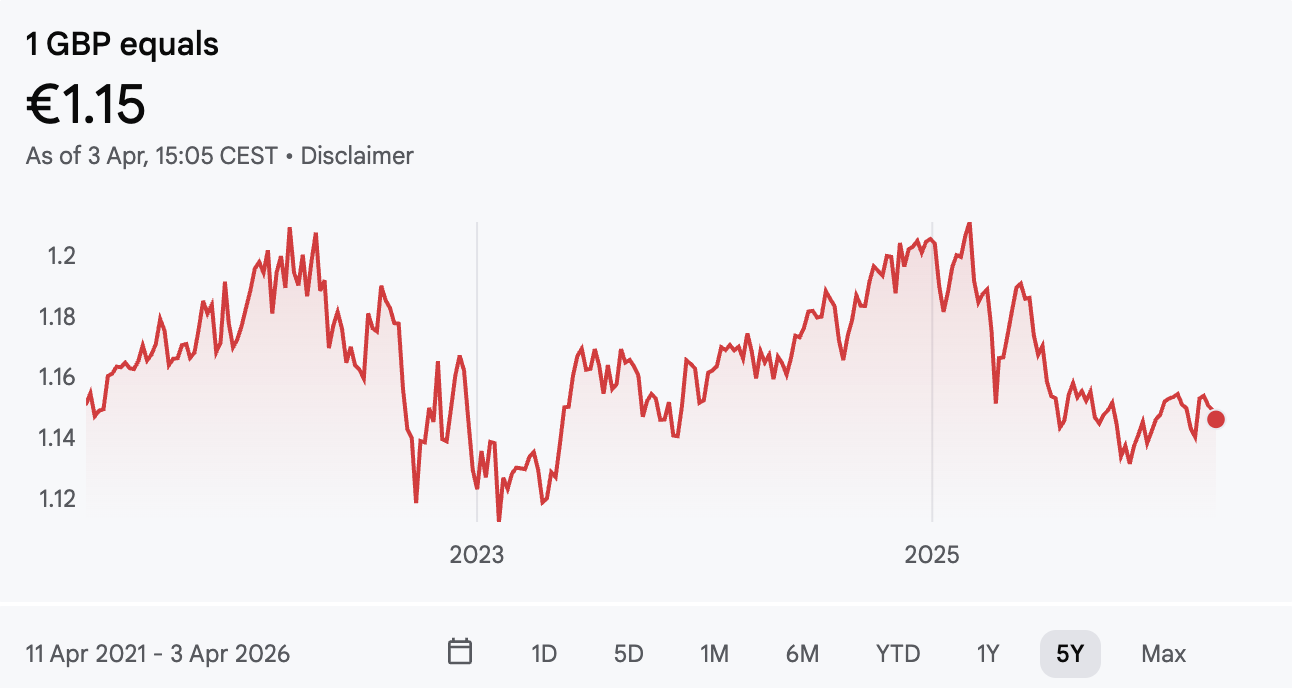
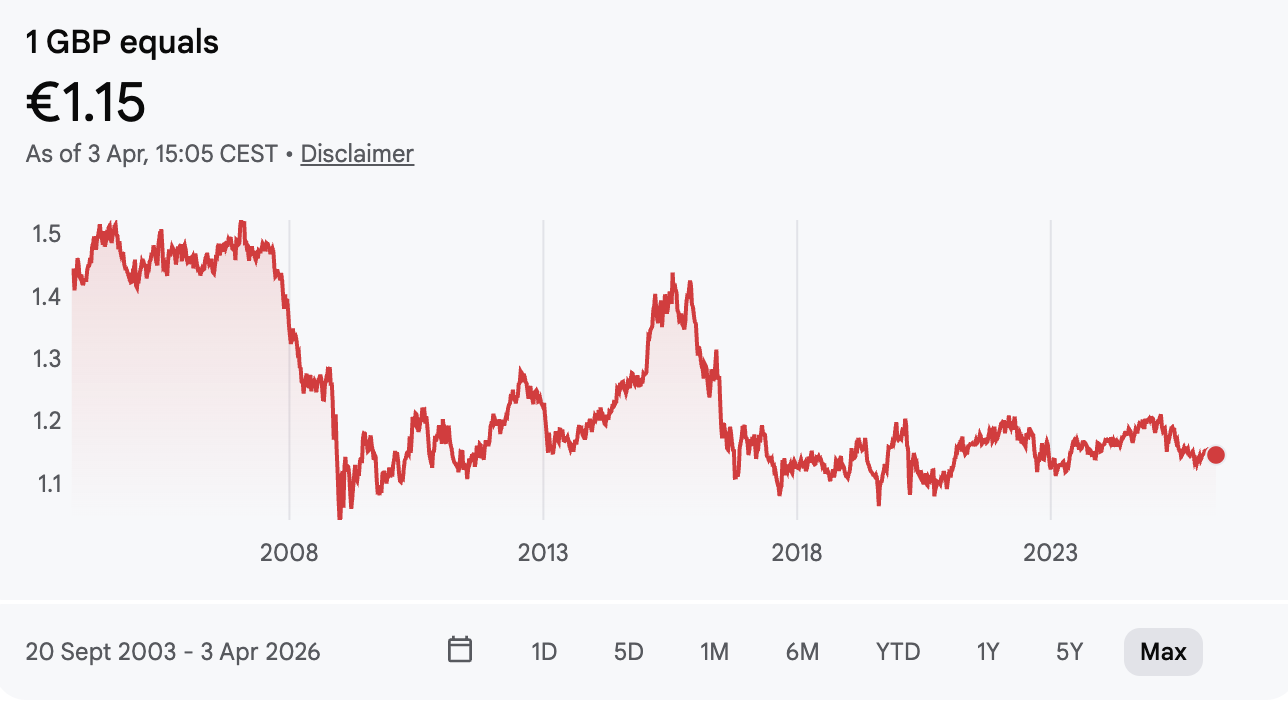
The chart shows the historical performance of the GBP/EUR exchange rate, helping to illustrate the impact of currency risk on income and costs relating to the UK.
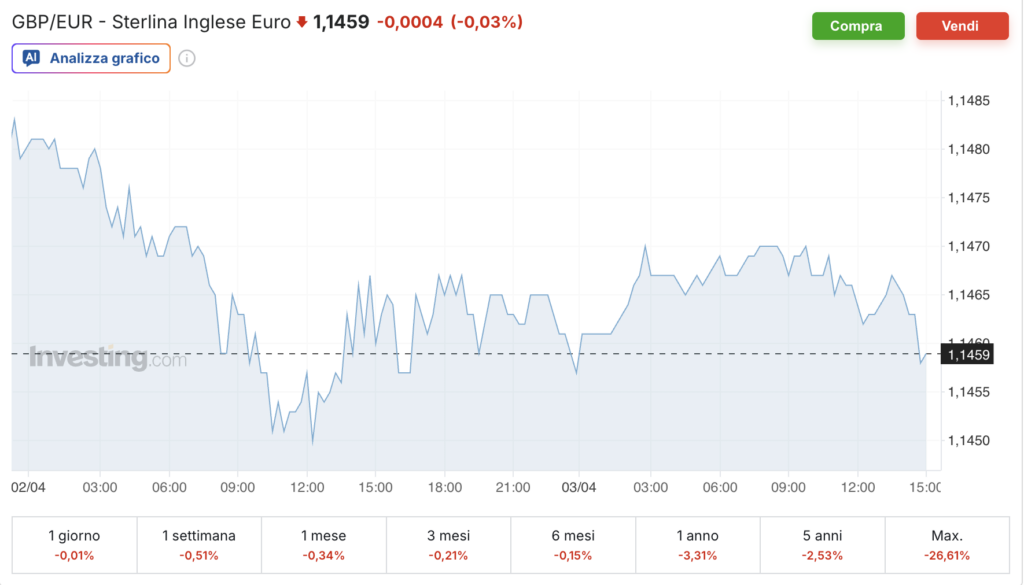
The GBP/EUR chart shows how sterling has performed against the euro over recent years, highlighting periods of strength and weakness in the UK currency. Italian investors can use this information to understand how exchange rate movements may affect the costs of setting up and operating a Limited Company. Peaks in the exchange rate can be associated with geopolitical events, such as Brexit, as well as divergent monetary policies between the European Central Bank (ECB) and the BoE. By analysing longer-term trends, investors can assess potential currency hedging strategies to manage exchange rate risk. The chart also shows average values and historical volatility, providing useful data for investment decisions.
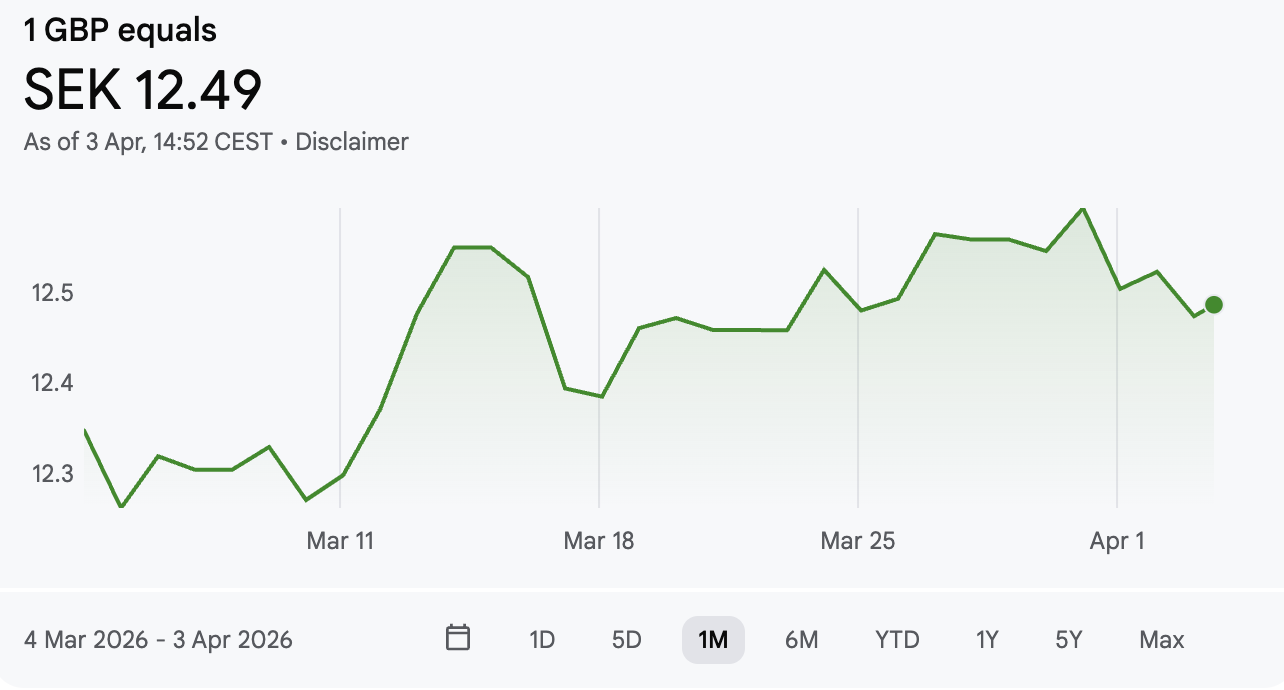
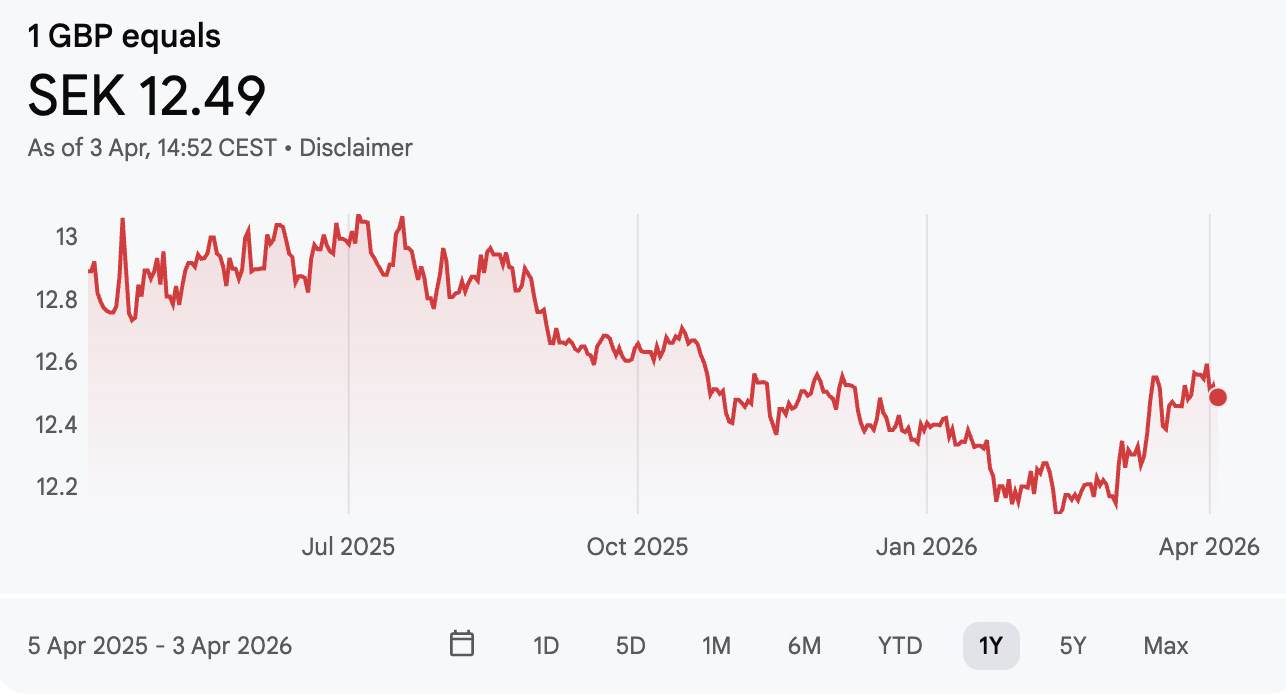
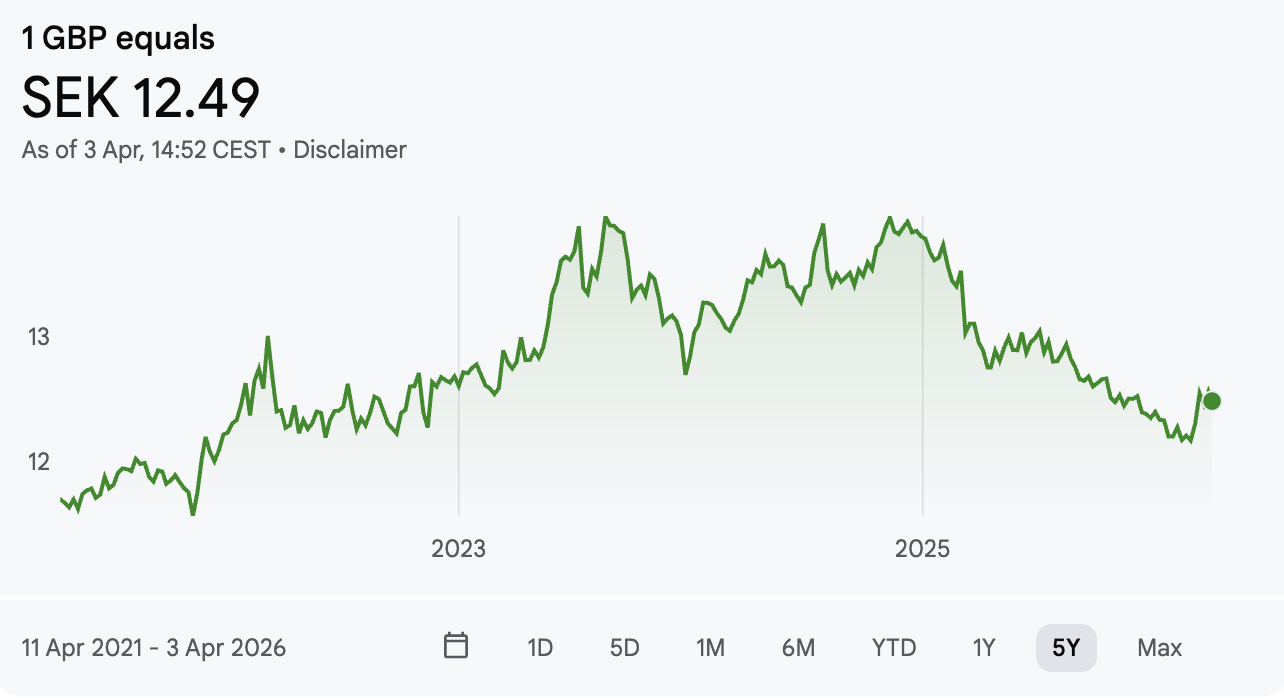
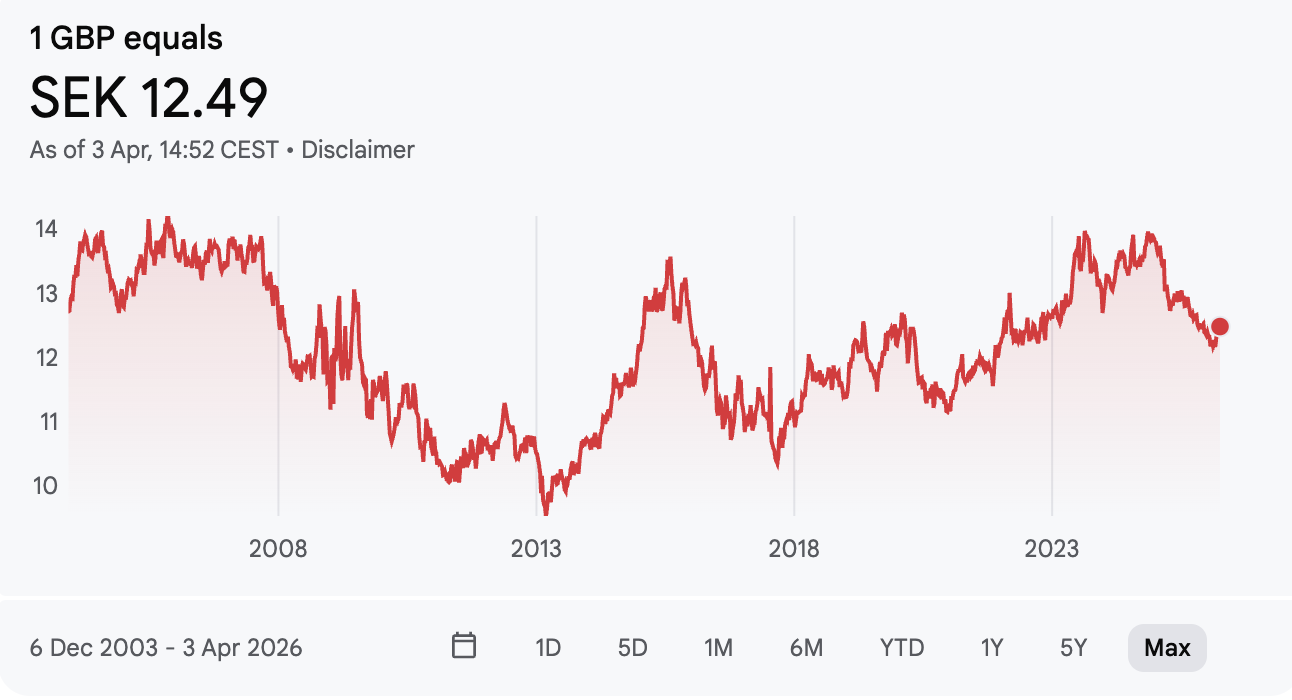
The chart shows the historical performance of the GBP/SEK exchange rate, helping to illustrate the impact of currency risk on income and costs relating to the UK.
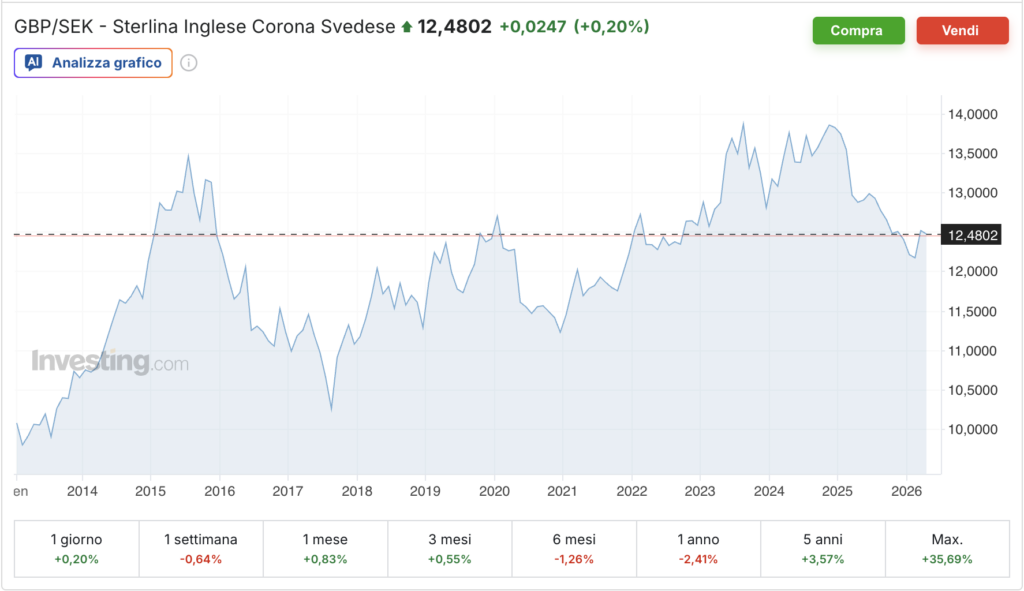
The GBP/SEK chart allows Swedish investors to assess how sterling has performed against the Swedish krona. The historical analysis shows periods in which sterling strengthened or weakened, affecting the cost of investments and commercial transactions between the UK and Sweden. Understanding these trends can help investors plan capital conversions and mitigate currency risk. The chart also highlights the impact of international macroeconomic events on the currency pair, including changes in interest rates and global crises. It also provides useful information for financial planning and liquidity management.
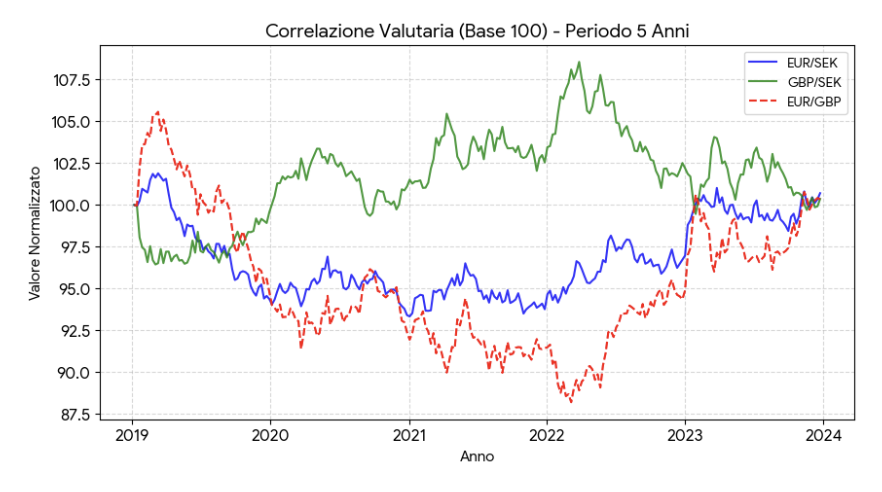
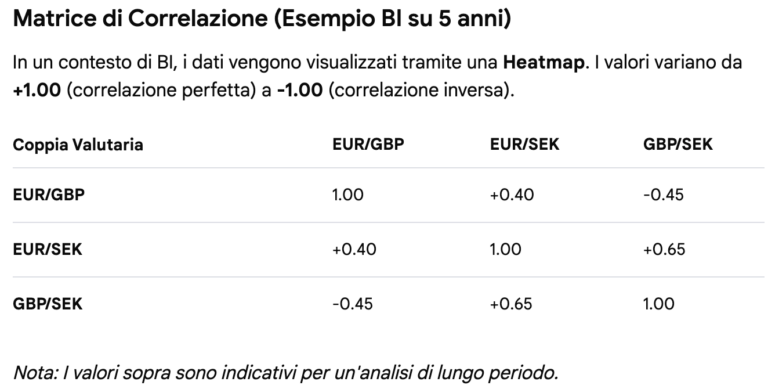
EUR/SEK and GBP/SEK (High Positive Correlation):
These two currency pairs often move in tandem. As both the euro and sterling are major currencies relative to the Swedish krona, which is particularly sensitive to global risk sentiment and Sweden’s export-driven economy, they tend to strengthen or weaken against the SEK simultaneously during European economic cycles.
EUR/GBP and GBP/SEK (Negative Correlation):
An inverse relationship can often be observed. When sterling (GBP) strengthens significantly, the EUR/GBP pair falls while GBP/SEK rises, creating a statistical divergence.
Stability Over 1–5 Years:
Over longer periods, the correlation between EUR/SEK tends to remain high due to Sweden’s strong trade links with the euro area.
However, geopolitical shocks, such as Brexit, can temporarily alter these correlation coefficients.
The correlation chart examines the statistical relationship between the EUR/GBP and GBP/SEK currency pairs, making it possible to analyse how movements in one currency may affect the others. Understanding these relationships is important when managing the overall currency risk of an international portfolio.
Investors can observe how sterling moves against the euro and the Swedish krona, helping them plan financial transactions in advance and reduce adverse currency exposure. The chart also highlights periods of strong correlation or divergence, providing additional analytical tools to support strategic decision-making.
This is particularly useful for those operating simultaneously across the UK, European and Scandinavian markets.
Taken together, the BoE’s official interest rate and the key exchange rates (EUR/GBP, GBP/SEK) provide a useful basis for making informed investment decisions in the UK. Understanding historical trends, highs and lows, and correlations between currencies can help investors assess the risks and opportunities associated with setting up a Limited Company. Italian and Swedish investors can use these tools to optimise capital conversions, reduce financial volatility and plan for the long term. Combining the charts with economic analysis provides an objective and detailed overview for those looking to operate in the UK market with greater clarity and confidence.
BoE interest rates influence borrowing costs, consumer spending and investment. Changes in, or stability of, interest rates can have a significant impact on financing costs for a business operating in the UK. \ Exchange rate charts help illustrate currency risks: a stronger GBP against the EUR or SEK reduces the cost of imports into the UK but may put pressure on export margins. A currency heatmap provides an overview of the relationships between currencies and can be useful when developing hedging strategies.